Web performance testing: Compare Grafana k6 browser vs. Google Lighthouse
This post was originally published on the Grafana blog which you can view here.
The Grafana k6 browser module simulates how users interact with a browser page and collects web performance metrics about the interaction. Since launching the module in 2021, we’re frequently asked how it compares to Google Lighthouse as a tool to measure web page performance.
This blog post compares k6 browser and Google Lighthouse from various perspectives, including:
- How these tools help with performance testing
- How these tools run tests
- What metrics the tools collect
- How the tools complement each other
Note: k6 browser is a part of Grafana k6 OSS. The goal of this blog post is to compare the k6 browser module — not the entire k6 ecosystem — with Google Lighthouse.
An overview of k6 browser vs. Google Lighthouse
When developing web applications, it’s crucial to test performance from a frontend or browser perspective — a concept we explain comprehensively in our guide to website load testing. Both k6 browser and Google Lighthouse can measure the performance of web applications, but there are key differences between the two.
k6 browser: Frontend testing with k6
k6 browser automates browser actions and collects frontend performance metrics as part of your existing k6 tests. With k6 browser, you can simulate a specific user journey on your website and find errors related to the user experience. When a k6 browser test finishes, it reports browser metrics that you can use as guidelines for your website’s performance. With k6 browser, you can also mix browser-level scripts with existing protocol-level scripts to implement a hybrid approach to performance testing.
Google Lighthouse: Measure overall website quality
Google Lighthouse is an open source tool that you can use to improve the overall quality of your websites. Apart from measuring performance, Google Lighthouse runs audits for accessibility, SEO, and more. These audits generate scores and a report with suggested changes to improve website quality.
Web performance tools comparison
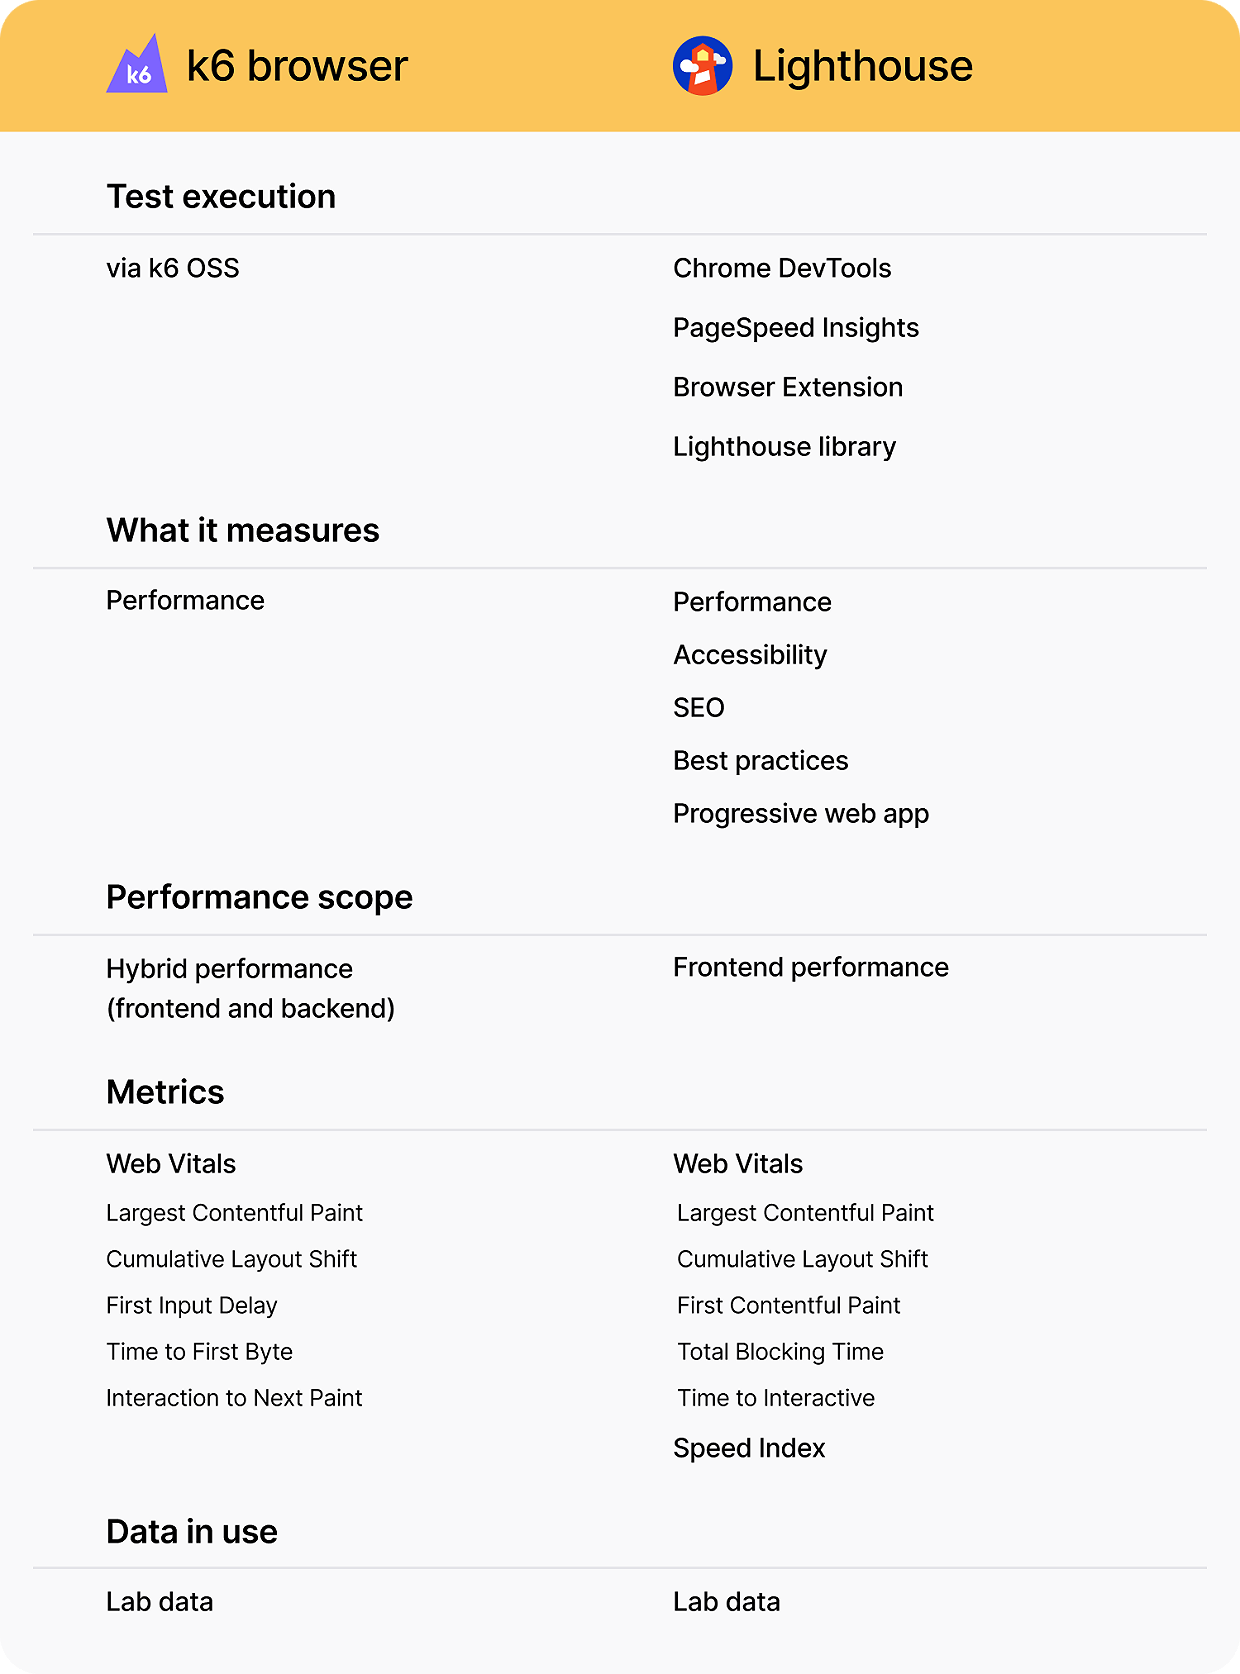
Again, while both k6 browser and Google Lighthouse measure web application performance, they differ in several ways.
The table below summarizes key comparison points between k6 browser and Lighthouse:

Running a web performance test
To measure the performance of your website, k6 browser provides an API similar to Playwright for some familiarity. Here is a sample code snippet:
import { chromium } from 'k6/experimental/browser'
import { check } from 'k6'

export default async function() {
 const browser = chromium.launch({ headless: false })
 const page = browser.newPage()

 // Navigate to the demo page and login
 await page.goto('https://test.k6.io/my_messages.php')
 page.locator('input[name="login"]').type('admin');
 page.locator('input[name="password"]').type('123');

 const submitButton = page.locator('input[type="submit"]');

 await Promise.all([page.waitForNavigation(), submitButton.click()]);

 check(page, {
   header: page.locator('h2').textContent() == 'Welcome, admin!',
 });

 page.close()
 browser.close()
}
A k6 browser test can be run only with k6 OSS. However, work is underway to make k6 browser available as part of Grafana Cloud k6.
On the other hand, a Lighthouse test can be generated in multiple ways, including:
- Chrome DevTools
- Programmatically via the Google Lighthouse library
- PageSpeed Insights
Note: This is not the complete list. You can also perform Lighthouse audits with tools such as WebPageTest and testing frameworks such as Playwright and Cypress.
Let’s look at these options briefly.
Chrome DevTools
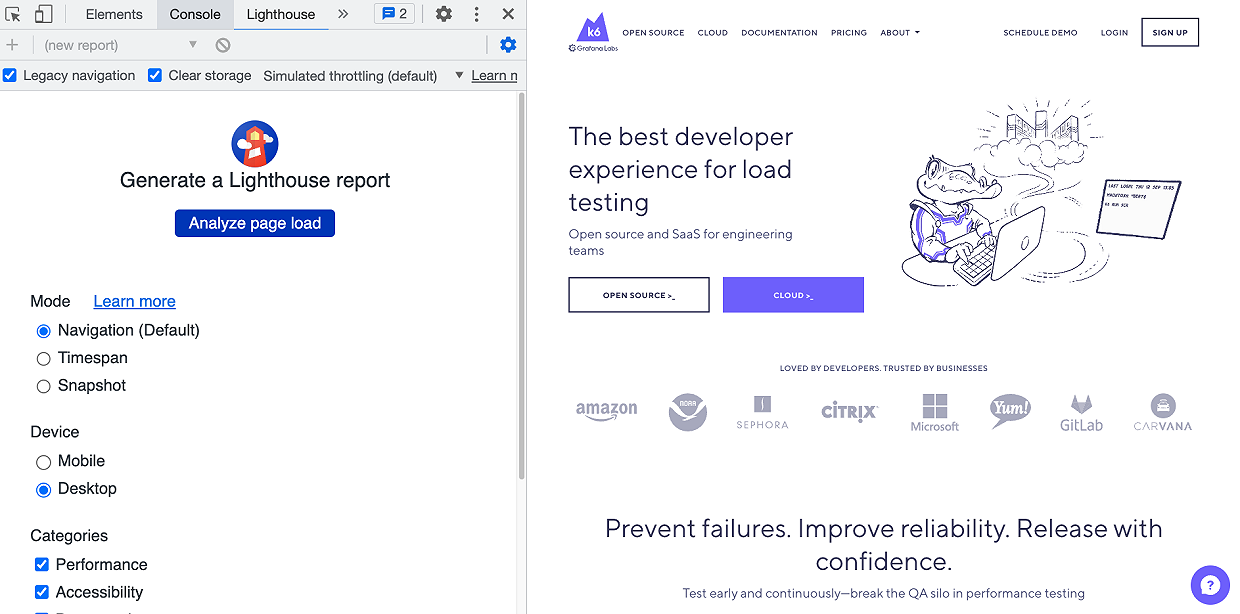
The most convenient way to run a Lighthouse test is with Chrome DevTools:
- Download Google Chrome
- Go to the URL you want to audit
- Open up DevTools and use the Lighthouse tab

Google Lighthouse library
For more flexibility or advanced use, the Google Lighthouse library can programmatically run audits with the command line or as a Node module.
PageSpeed Insights
PageSpeed Insights is another free tool that lets you run Lighthouse tests. It uses real-world data on top of the lab data Lighthouse uses. To run a test, navigate to PageSpeed Insights, enter the URL you want to audit, and see a report of your website’s performance.
Web performance testing strategy
A holistic performance testing strategy must account for both frontend and backend performance. A recommended approach is hybrid performance testing, which combines protocol-level tests with browser-level tests simultaneously.
Lighthouse measures only the frontend performance of your application, so you will need to use another tool to measure the backend performance. k6 browser, on the other hand, supports a hybrid approach by leveraging the existing functionality of k6.
Web performance metrics
When it comes to browser performance metrics, both k6 browser and Lighthouse report Google Web Vitals. Web Vitals are the current standard engineers use to measure the user experience for a website.
Historically, k6 browser has reported only a few browser metrics, such as browser_loaded and browser_dom_content_loaded. However, these metrics do not accurately reflect the user’s experience as well as they used to. these metrics have now been removed as of k6 version 0.45.0 in favor of the Web Vitals. Web Vitals are a better measure of your page’s performance and user experience.
Core Web Vitals
Core Web Vitals are the holy trinity when it comes to web performance. These metrics apply to all web pages and measure the page’s loading performance, interactivity, and visual stability.
Even though both k6 browser and Lighthouse report Web Vitals, there are some differences in what they report.
Lighthouse doesn’t measure First Input Delay (FID) because this requires a real user interaction, and Lighthouse, by default, only analyzes the initial page load. On the other hand, k6 browser can measure FID because it provides an API that lets you script user interactions.
Other Web Vitals
Both k6 browser and Lighthouse also track metrics known as the Other Web Vitals. These metrics are not mandatory but can provide additional insights into the user experience.
Lighthouse also tracks a metric called Speed Index, which is not part of Google Web Vitals.
Lab vs. field data
The last area of comparison is the data both tools use. Lighthouse uses lab data, meaning data that is collected from a controlled environment using predefined devices and network settings. By using lab data, you can test for performance earlier, which is one reason why Lighthouse is a popular choice. While it can’t measure metrics that require real user interaction, such as FID, Lighthouse can measure Total Blocking Time (TBT), which is a good alternative.
k6 browser also falls into the lab data category. The metrics it reports are from isolated executions handled by k6 and with specific test configurations.
To accurately measure Core Web Vitals, you need field data. Unlike lab data, field data is gathered from actual users, so it more closely represents the user experience. Tools such as PageSpeed Insights and Chrome User Experience Report can provide these insights from real users. Another option is to use real-user monitoring observability solutions such as Grafana Faro to monitor the frontend experience of real users.
Can I use both web performance testing tools?
When it comes to web performance, we recommend using as many tools as possible to improve your website’s overall user experience.
Lighthouse is excellent for early feedback and diagnostics to quickly fix any low-hanging-fruit issues with your website’s performance. But if you want to measure the web performance and also leverage a hybrid approach to performance testing, k6 browser is a great tool.
Keep in mind that both Lighthouse and k6 browser provide lab data. To accurately measure real user experience, you still need to supplement it with other tools that report field data.