An Introductory Guide to Web Performance Testing
This post was originally published on the Abstracta blog which you can view here.
From a very young age, we have all been exposed to a lot of waiting times. As kids, we must wait our turn to hit the piñata during birthday parties. As adults, we face queues everywhere, from paying for groceries to buying the latest phone models. Waiting is not an enjoyable activity for most people, especially if they are used to the instant gratification that most technologies nowadays provide. It’s known that people’s patience goes thinner as technology moves faster.
Usability studies dating back to the 90s, as mentioned in this article, The Need for Speed by Jakob Nielsen, show that fast response times are essential for web usability. Websites should be created with speed in mind for users to have a great user experience. Nowadays, users are swift to close a tab or a window if the website they use has a “sluggish” feel. Slow performance can also negatively impact the business because users will go to their competitors if their website isn’t up to the speed users are used to.
This guide will give an overview of the following:
- What is web performance?
- Impacts of a slow website
- How fast should websites be?
- Web performance metrics
- Tools for testing web performance
- A hybrid approach to performance testing.
What is web performance?
Some of us think about server or backend performance when we talk about performance in general, so we make optimizations within that. However, performance improvements don’t stop here. Just because our servers have responded with the request that the user has requested doesn’t mean that it’s displayed to them instantly.
Simply put, web performance is about how performant or fast your website is when your users load it.
Multiple factors, such as the amount of CSS or Javascript files being downloaded, the browser your users are using, device capabilities, and network connectivity, can impact the loading time of your website.
Impacts of a slow website
People have been complaining about slow websites since the dial-up days. However, even in today’s age, where we have faster internet connections, we still complain about slow websites! Social media has made it more accessible as well to share our frustrations.
This up-to-date study of web responsiveness shows that the median page download times are 6 seconds on desktop and, worse, 20 seconds on mobile. We have faster connections, but websites aren’t that much quicker than they were ten years ago. No wonder people are still complaining!
A slow website doesn’t just impact your user’s experience. The speed of your website can also hugely impact your business reputation, revenue, and even your search engine ranking. Google announced that page speed is now a factor for their search algorithm and ranking.
Here are some examples of how slow websites have impacted/could impact a business:
- Amazon found that for every 100ms delay in page load, they encounter a 1% loss of sales revenue.
- Akamai has conducted a study showing that consumers become impatient when a page takes longer than two seconds to load, resulting in a higher bounce rate.
These examples demonstrate that web performance is crucial to providing the best user experience, and improving critical metrics related to performance positively impacts a business’ revenue and search ranking. If you’re not convinced, check WPO stats for a collection of case studies demonstrating how different companies saw improvements when they made some performance optimization.
How fast should websites be?
Page speed is the key indicator you need to look out for regarding web performance. But how fast should the page response times be? Is there a magic number that you need to know?
Jakob Nielsen summarised this well in his article, Response Time: The 3 Important Limits, where he stated that:
- 0.1 second is about the limit for having the user feel that the system is reacting instantaneously, meaning that no special feedback is necessary except to display the result.
- 1.0 seconds is the limit for the user’s flow of thought to stay uninterrupted, even though the user will notice the delay. Normally, no special feedback is necessary during delays of more than 0.1 but less than 1.0 seconds, but the user does lose the feeling of operating directly on the data.
- 10 seconds is the limit for keeping the user’s attention, focused on the dialogue. For longer delays, users will want to perform other tasks while waiting for the computer to finish, so they should be given feedback indicating when the computer expects to be done. Feedback during the delay is especially important if the response time is likely highly variable since users will then not know what to expect.
As a general rule of thumb, your website should load as fast as possible but not too fast so your users cannot keep up with what they are doing.
The perceived performance of your website also matters a lot. Perceived performance is how fast the website feels to a user subjectively rather than the actual measure itself. For example, it’s better to show your users a visual indicator, in the form of progress bars or loading animations, that something is happening rather than not show any progress at all. This way, your users feel engaged and time flies faster when you are doing an engaging activity.
Web performance metrics
In order to know how fast your website is, there are a few metrics specific to web performance that you need to know. These metrics are not set in stone but are helpful indicators to understand how your website performs.
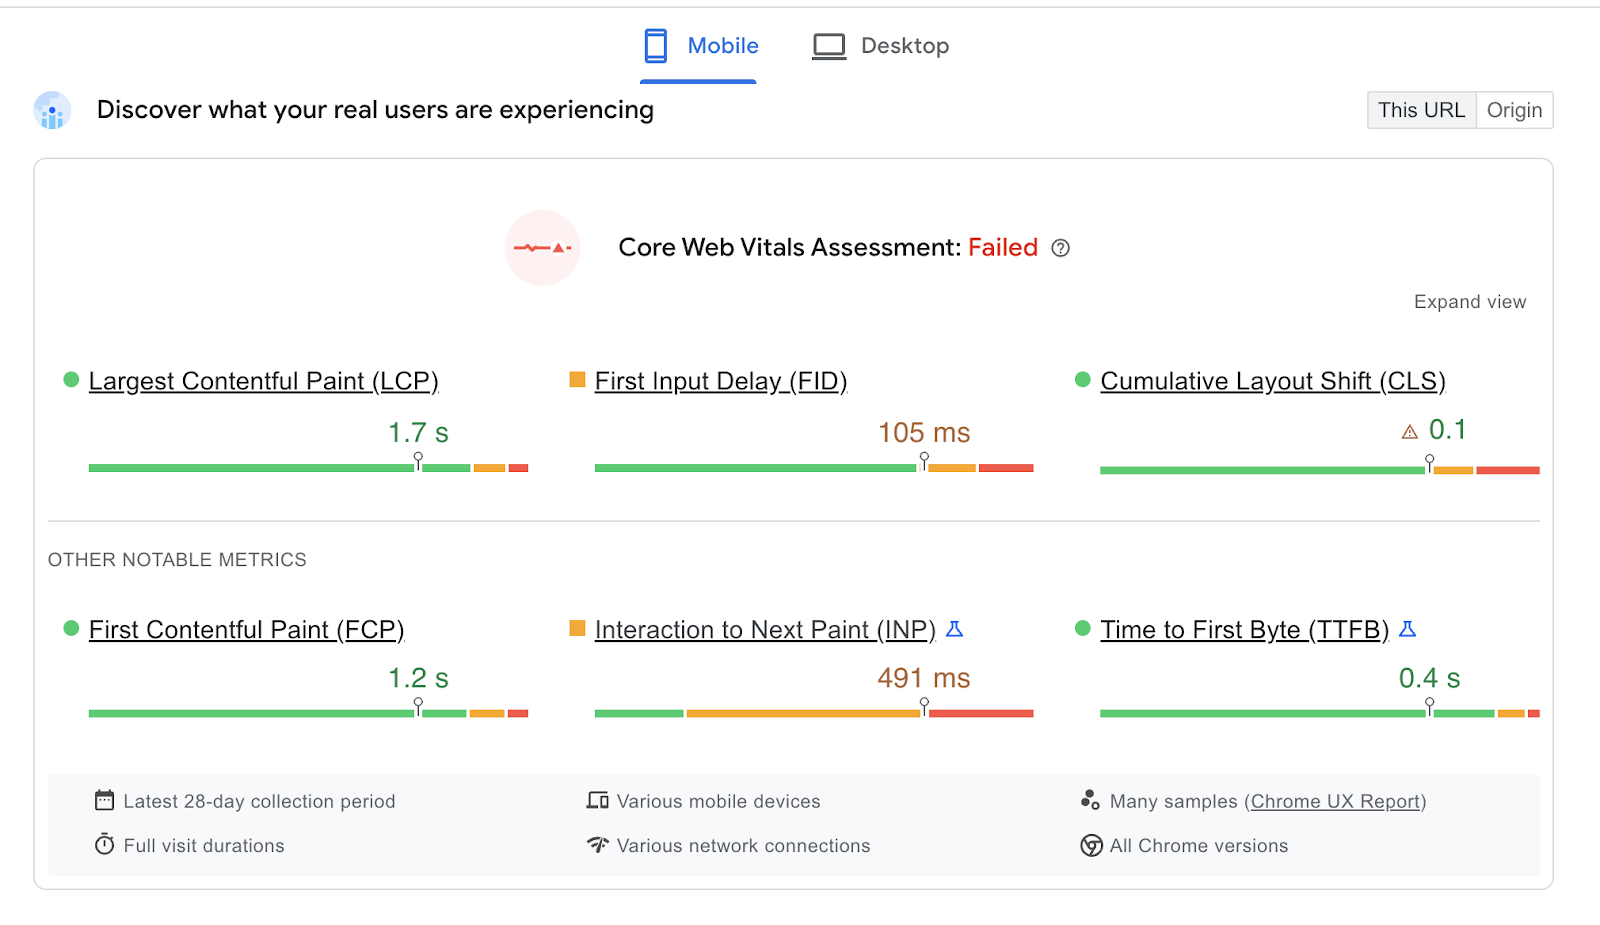
Web vitals are metrics that Google considers essential regarding browser performance and user experience. To simplify the metrics that matter the most, I will summarize the core web vitals you need to know. These vitals are what Google considers to be the most important and should be applied to all websites.
- Largest Contentful Paint (LCP) – measures the amount of time it takes a browser to render the page’s largest content, such as images or videos within the visible viewport.
- First Input Delay (FID) – measures your user’s first impression of your website’s responsiveness. FID tells us how long your users must wait for a response after interacting with a page.
- Cumulative Layout Shift (CLS) – measures the largest burst of unexpected layout shift in your website. Elements that shift unexpectedly may cause real damage to your user’s experience. Note that the core web vitals will evolve to reflect any new technological changes.
Apart from the core web vitals, it’s also good to know other web vitals to understand your user’s experience better.
- Time to First Byte (TTFB) – measures the time between the request for a resource and when the first byte of response begins to arrive.
- First Contentful Paint (FCP) – measures the amount of time it takes a browser to render any piece of content from the page.
- Total Blocking Time (TBT) – the time the browser’s main thread is blocked due to long tasks, preventing input responsiveness.
- Time to Interactive (TTI) – measures the time it takes for a page to be fully interactive.
Tools for testing web performance
To ensure that your users have the most optimal experience, you need tools and libraries to help you with web performance testing. The list below is not comprehensive but should help you get started.
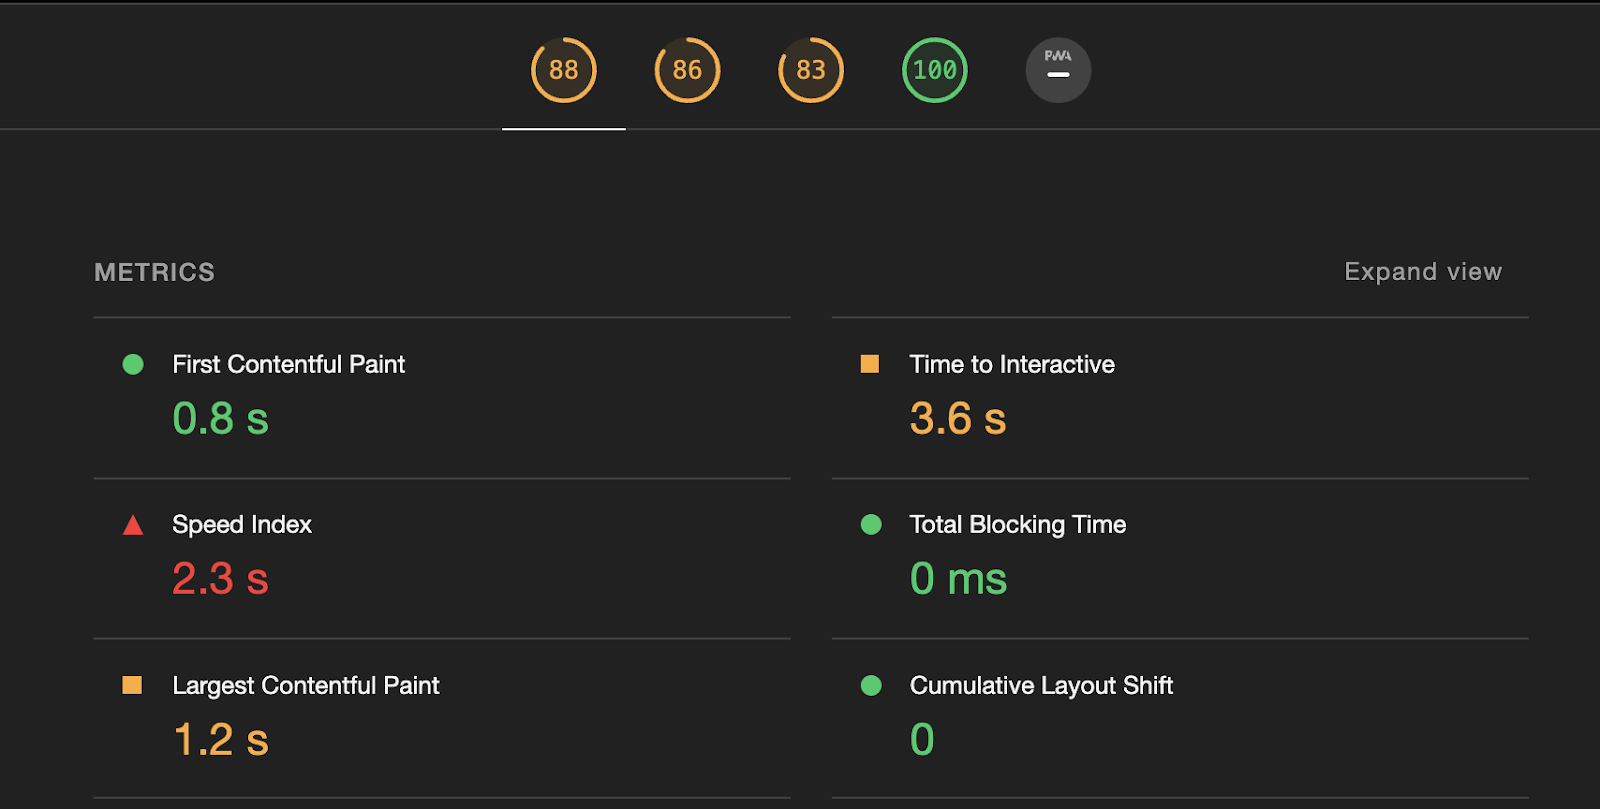
Google Lighthouse
Google Lighthouse is an open-source tool for auditing and improving the quality and performance of your website. Apart from measuring performance, it also measures other aspects, such as accessibility or SEO. Lighthouse can be run as part of Chrome DevTools, from the command line, or as a Node module. Lighthouse provides an audit score and a clear breakdown of issues that slow down your website.

Google Lighthouse uses lab data which is data that’s collected from a controlled environment using predefined devices and network settings.
PageSpeed Insights
Like Google Lighthouse, PageSpeed Insights also allows you to audit the performance of your website and provides an assessment of the core web vitals. It’s also using Google Lighthouse under the hood, but unlike Google Lighthouse, PageSpeed Insights also uses field data collected from real users.

WebPageTest
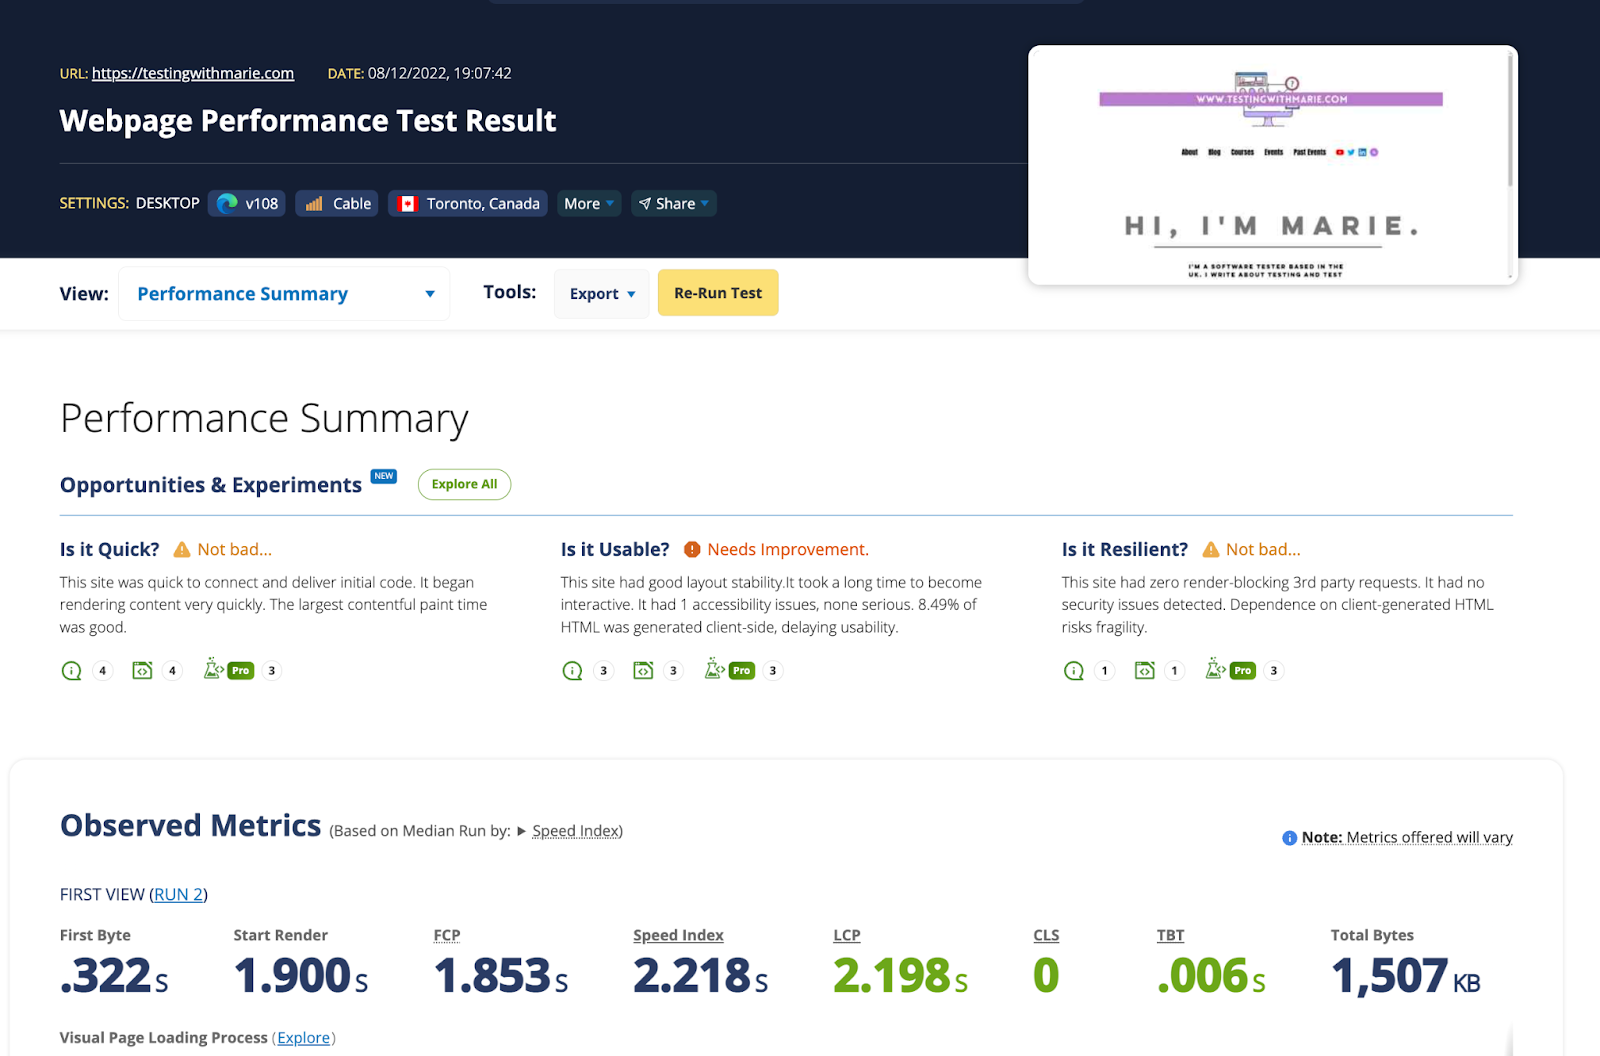
WebPageTest provides comprehensive and deep diagnostic information about a page’s performance. Like Google Lighthouse, it uses lab data, but it allows you to simulate your test to run under various network conditions, browsers, and locations worldwide.

You can add the following tools to your continuous integration pipelines to enable continuous performance testing.
Grafana k6 browser
k6 browser enables you to get insights from your front-end application during performance testing while supporting all of the core features of Grafana k6.
With k6 browser, you can simulate the bulk of your traffic from your protocol-level tests and run one or two virtual users on a browser level to mimic how a user interacts with your website, thus leveraging a hybrid approach to performance testing, which I will talk a bit more later. To find out more about k6 browser, check out k6 browser documentation.
cypress-audit
cypress-audit is a Cypress plugin that lets you integrate Google Lighthouse scores straight from your Cypress tests. To get an overview of how it works, check out cypress-audit documentation.
Playwright
Playwright also allows you to access various web performance APIs to measure your website’s performance inside your code. Here’s an excellent meetup talk by John Hill where he talked about Performance Testing using Playwright.
A hybrid approach to performance testing
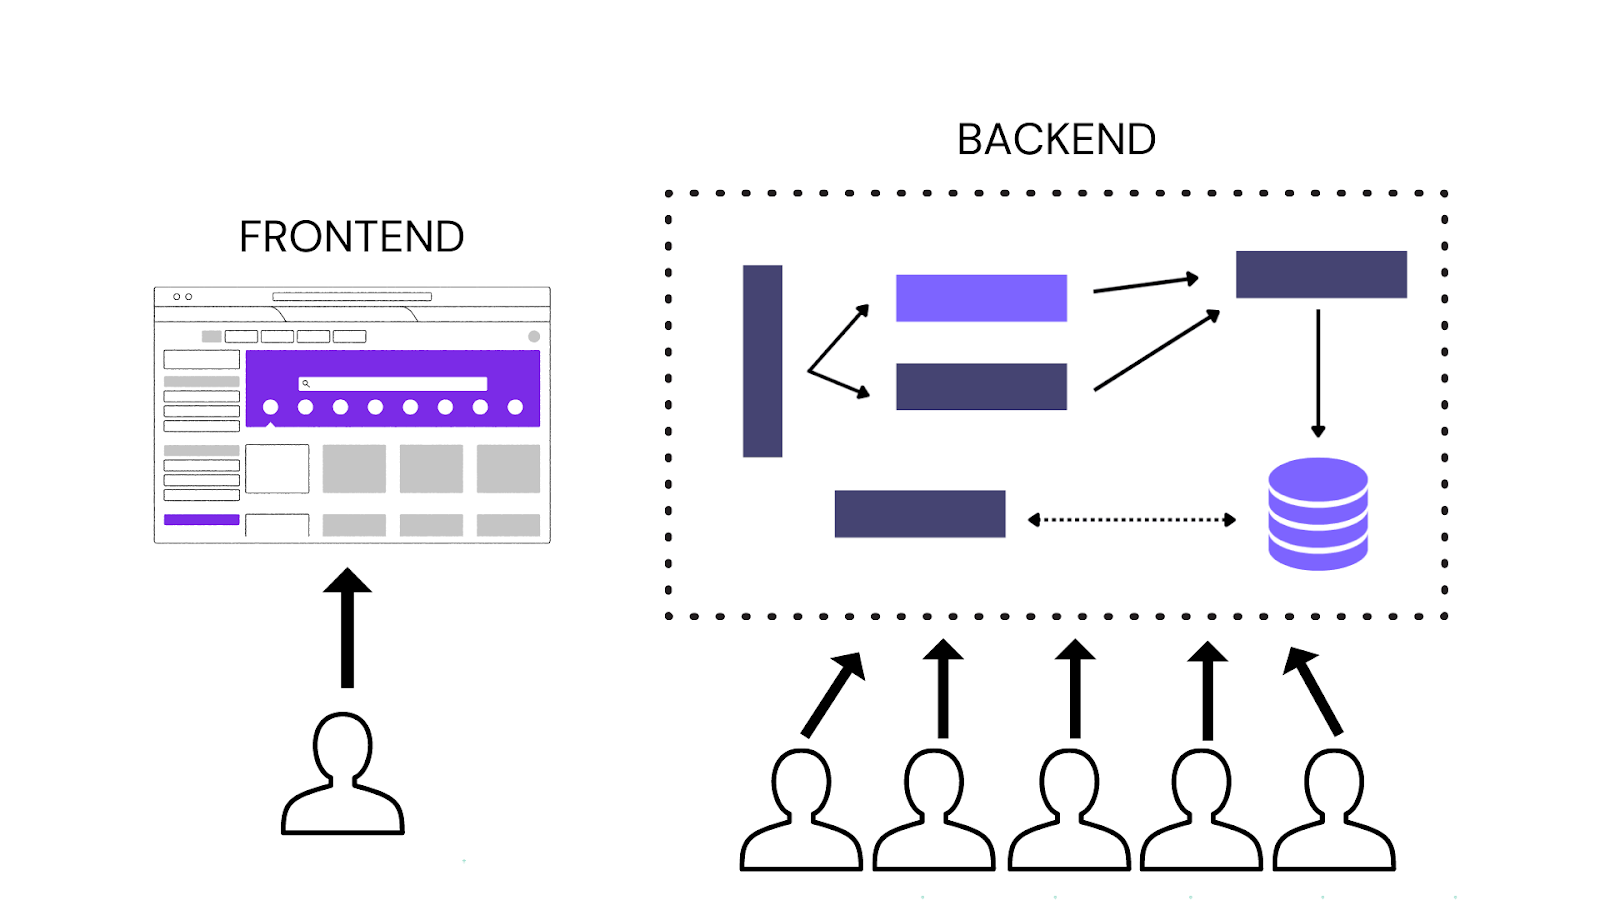
So far, I have only been talking about web performance. Web performance is just one side of the coin. If you only consider web performance, this can lead to false confidence in overall application performance when the amount of traffic against an application increases.
You must also test your backend systems to have a complete picture of your application’s performance. A common way to test for backend performance is to do load testing via the protocol level since you can easily simulate thousands of requests concurrently.
However, there are problems associated with testing via the protocol level, such as:
- Not being closer to the user experience since it’s skipping the browser,
- Scripts can be lengthy to create and difficult to maintain as the application grows,
- Browser performance metrics are ignored.
On the other hand, if you perform load testing by spinning up a lot of browsers, this requires significantly more load-generation resources, which can end up quite costly.
To address the shortcomings of each approach, a recommended practice is to adopt a hybrid approach to performance testing, which is a combination of testing both the backend and frontend systems via protocol and browser level. With a hybrid approach, you spin up the majority of your load via the protocol level, then simultaneously have one or two browser-level virtual users, so you can also have a view of what’s happening on the front end.

There are several ways to perform this approach:
- Use a single tool for both, such as xk6-browser, which can offer a simplified experience and aggregated view of performance metrics.
- Use a combination of different tools simultaneously. For example, you can use any of the tools mentioned above, such as Google Lighthouse or WebPageTest, in conjunction with protocol-level tools such as JMeter, k6, or Gatling.
Whichever approach or tool you choose, the important thing is to consider your requirements carefully. For example, you can start by prioritizing frontend performance with the overall goal of having a test that also covers the performance of your backend application.
Wrapping up
Companies spend time trying to make their websites beautiful. However, studies show that more than functionality is needed. Speed and performance are equally important, so performance testing is crucial nowadays. While load testing remains an excellent approach for testing the scalability and reliability of your applications, testing for web performance is needed to test the overall user experience.
For additional resources, check out: