Shifting Performance Testing to the left with k6
In one of my previous posts, I talked about using Taurus for performance testing, which is an open source tool created by Blazemeter. Nowadays, there are tons of tools out there that you and your team can use when automating performance tests for your application. In this blog post, I’ll talk about a tool that I’ve heard recently, called k6. I haven’t used k6 before but I’m always on the lookout for new tools as it’s good to get yourself familiarised with different options so you can provide the best tool to your team when it comes to a specific requirement.
So, what is k6?
k6 is a developer centric tool for writing performance tests for your application. It’s a free and open source tool created by Load Impact who aims to provide a great developer experience when it comes to writing performance tests. Similar with other tools, it can be used to detect performance issues on your application and can support tests such as load testing or stress testing. k6 is written in Go but can execute tests that are written in Javascript which should be familiar to a lot of developers. It can integrate easily to any CI/CD tools which can help you detect performance issues earlier on.
Why was k6 created?
As you might know, with the increasing popularity of Shifting Left and DevOps, automation has been integral when it comes to adopting these approaches and the lines between the roles of developers and testers are becoming blurry in some areas. Traditionally, performance testing has been known to be completed after a feature has been deployed and run by dedicated performance engineers which creates this siloed approach that DevOps is trying to break.
k6 was created to push performance testing as early on as possible and to encourage developers to write performance tests as well. This encourages more collaboration amongst teams and better knowledge sharing. Testers who have experience in performance testing are often equipped with the expertise and know how and by using a performance testing tool that is developer friendly, developers can learn to integrate this in their workflow. This way, the responsibility is shared and not owned by a single person or role. This is a trend that I’m seeing a lot recently in other areas as well. For example, tools such as Cypress was created to help developers write automated tests on the UI level. CI/CD tools such as CircleCI are written in human readable language for easy adoption and maintenance. By introducing a tool that is easy to use, you can eliminate silos and get more buy-ins from everyone involved in your team. Performance testing should not be an exception and this is what k6 is trying to address.
Installation
Similar with Taurus on one of my previous post, if you are a Mac user, k6 can also be installed easily using Homebrew.
brew install k6
For Windows and Linux users, you can refer to the installation guidelines. k6 also has an official k6 Docker image which is great if you want to run your performance tests on containers.
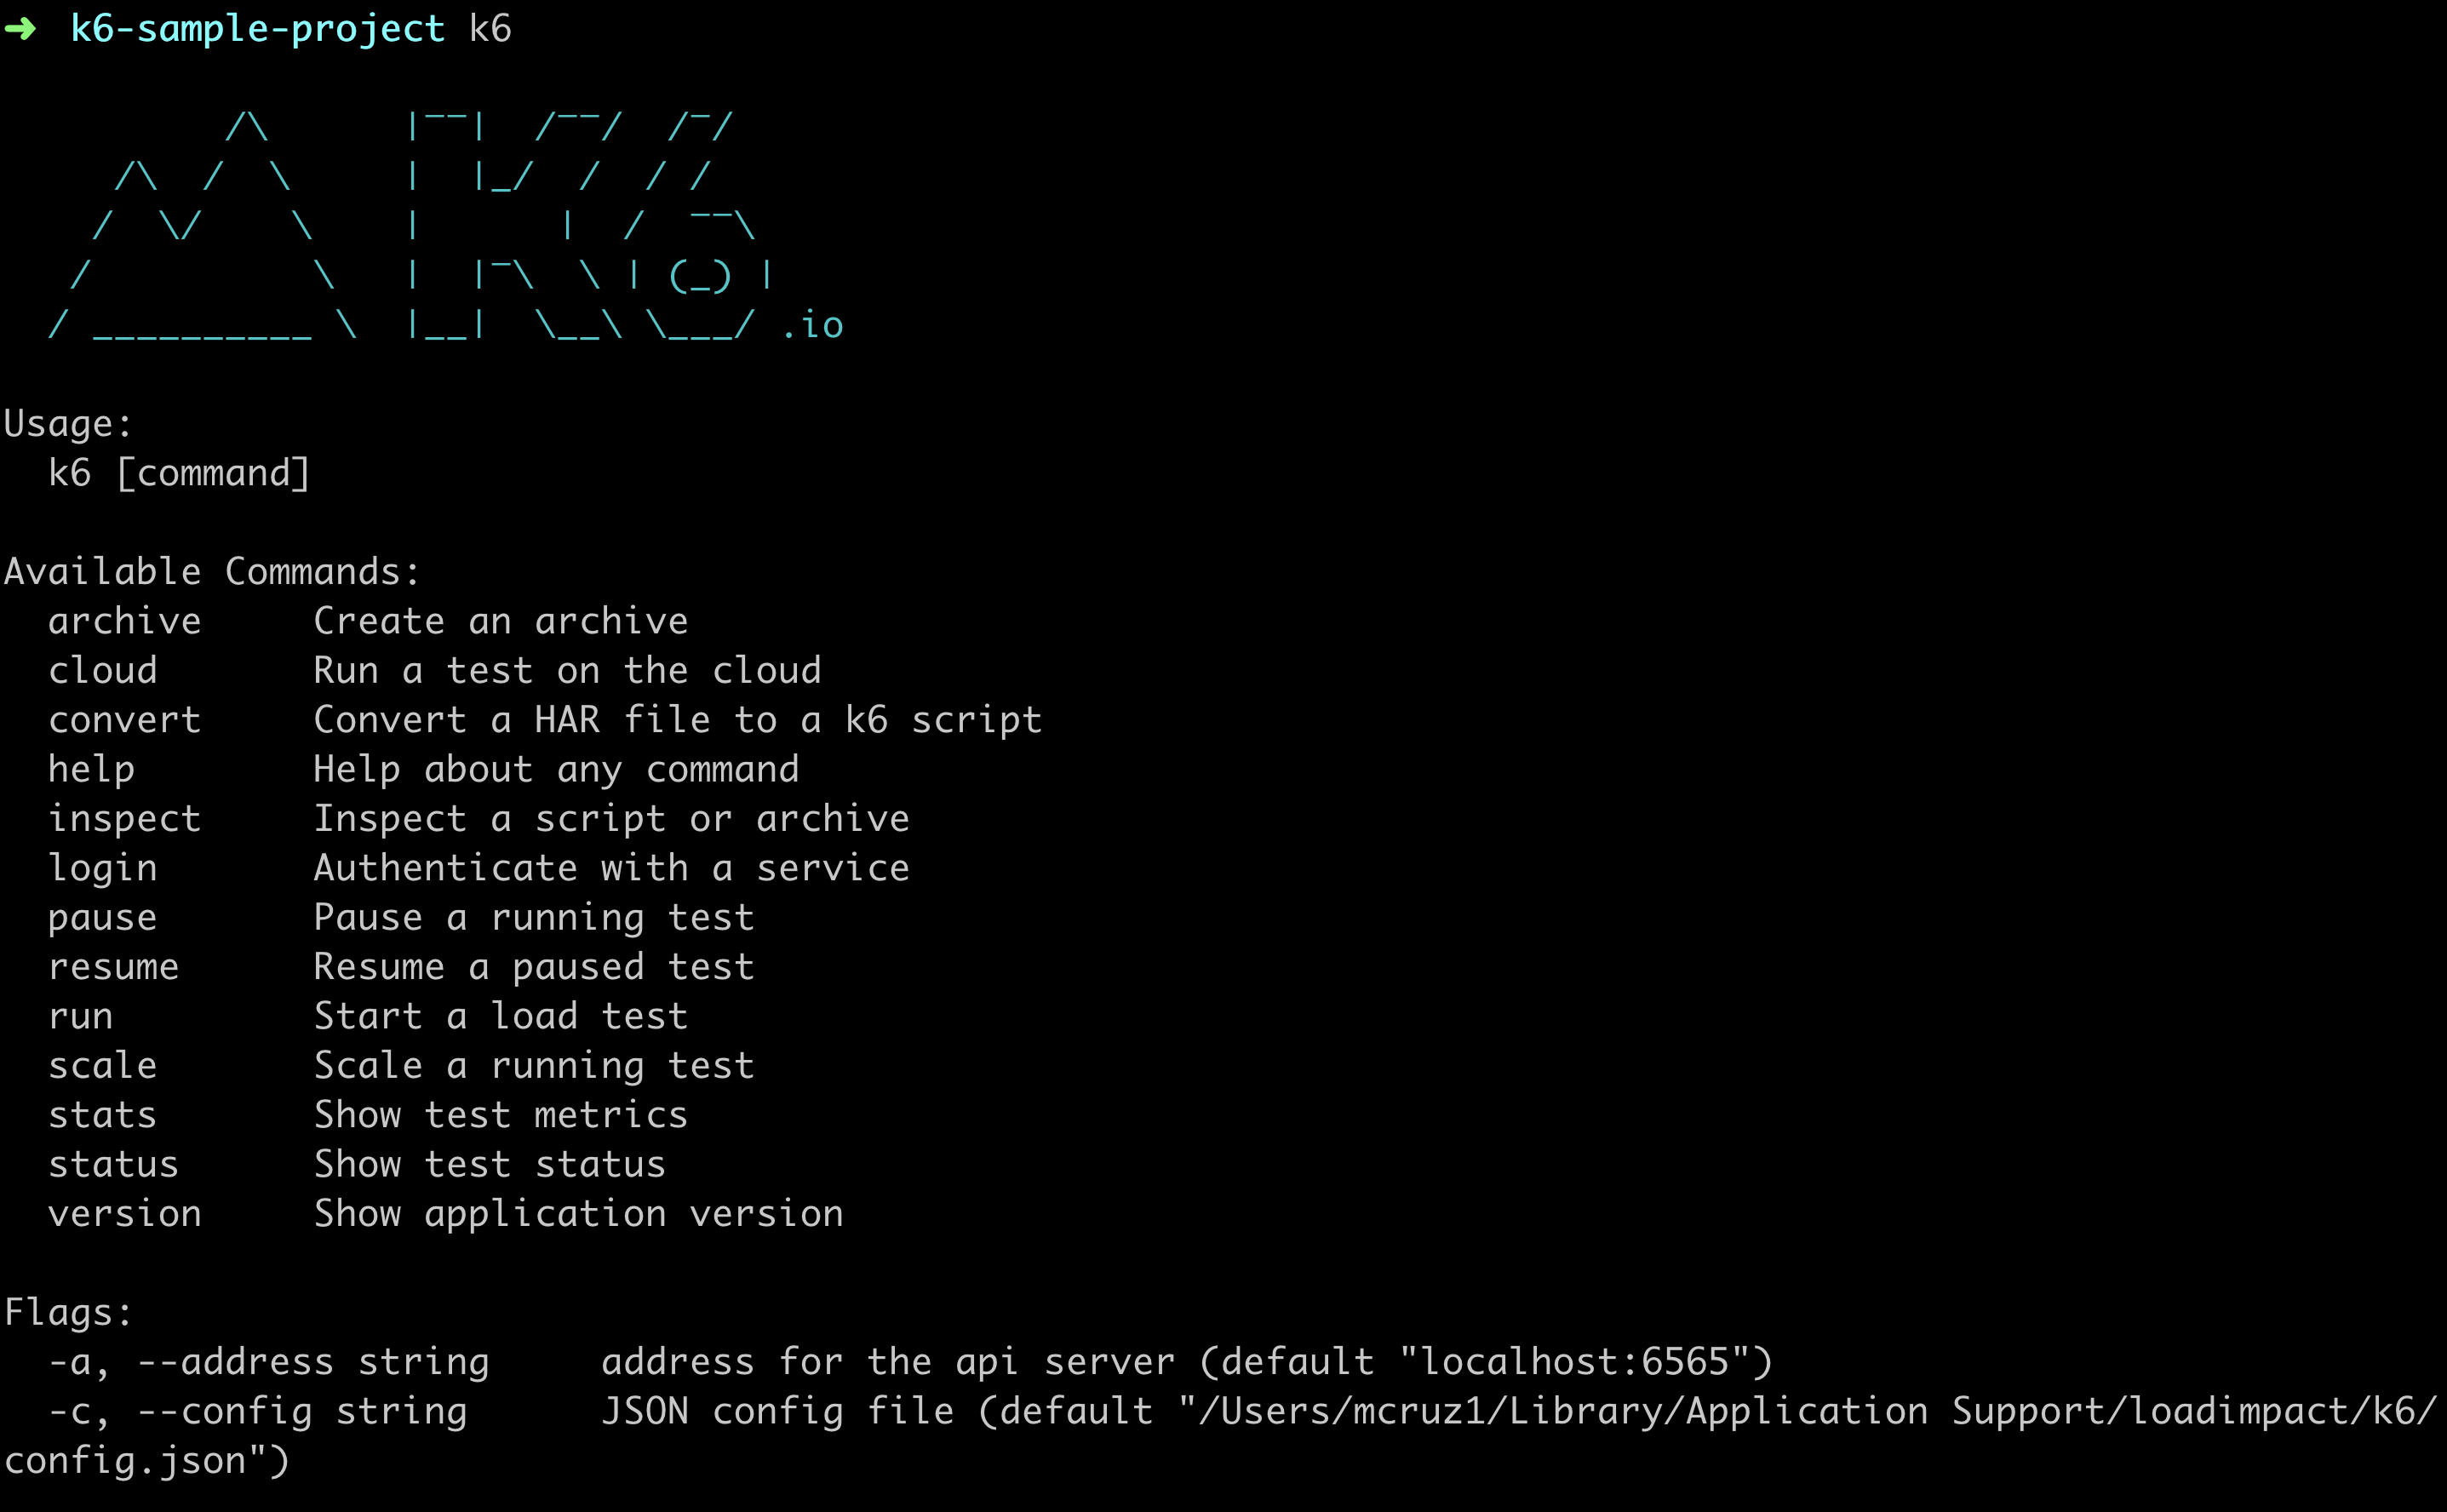
Once that’s installed, typing in k6 in to your terminal should generate a similar output like the one below:

Writing our first k6 test
Let’s write a simple test to understand how k6 works. I’ve added all the code that you can see here on this k6 sample Github repository so you can also access it easily.
import http from 'k6/http';
import { check } from 'k6';

export default function () {
  let res = http.get('http://jsonplaceholder.typicode.com');

  check(res, {
    'is status code 200': (r) => r.status === 200,
  });
}
Let’s see what’s happening here.
First, we need to import the http object from k6 which will allow us to perform API requests to our example API endpoint. We also need to import check so we can perform some basic assertions later on.
We need to export a default function which will be run when we call this test file later on. This represents your test scenarios. In this function, we are doing a GET request to the jsonplaceholder API and storing the response of this request to a variable. We then make use of the check import from k6 to verify the response if it has status code 200.
To run the above test with 10 virtual users on a 30 seconds duration for example, you can run the following on your terminal.
k6 run -u 10 -d 30s test-script.js
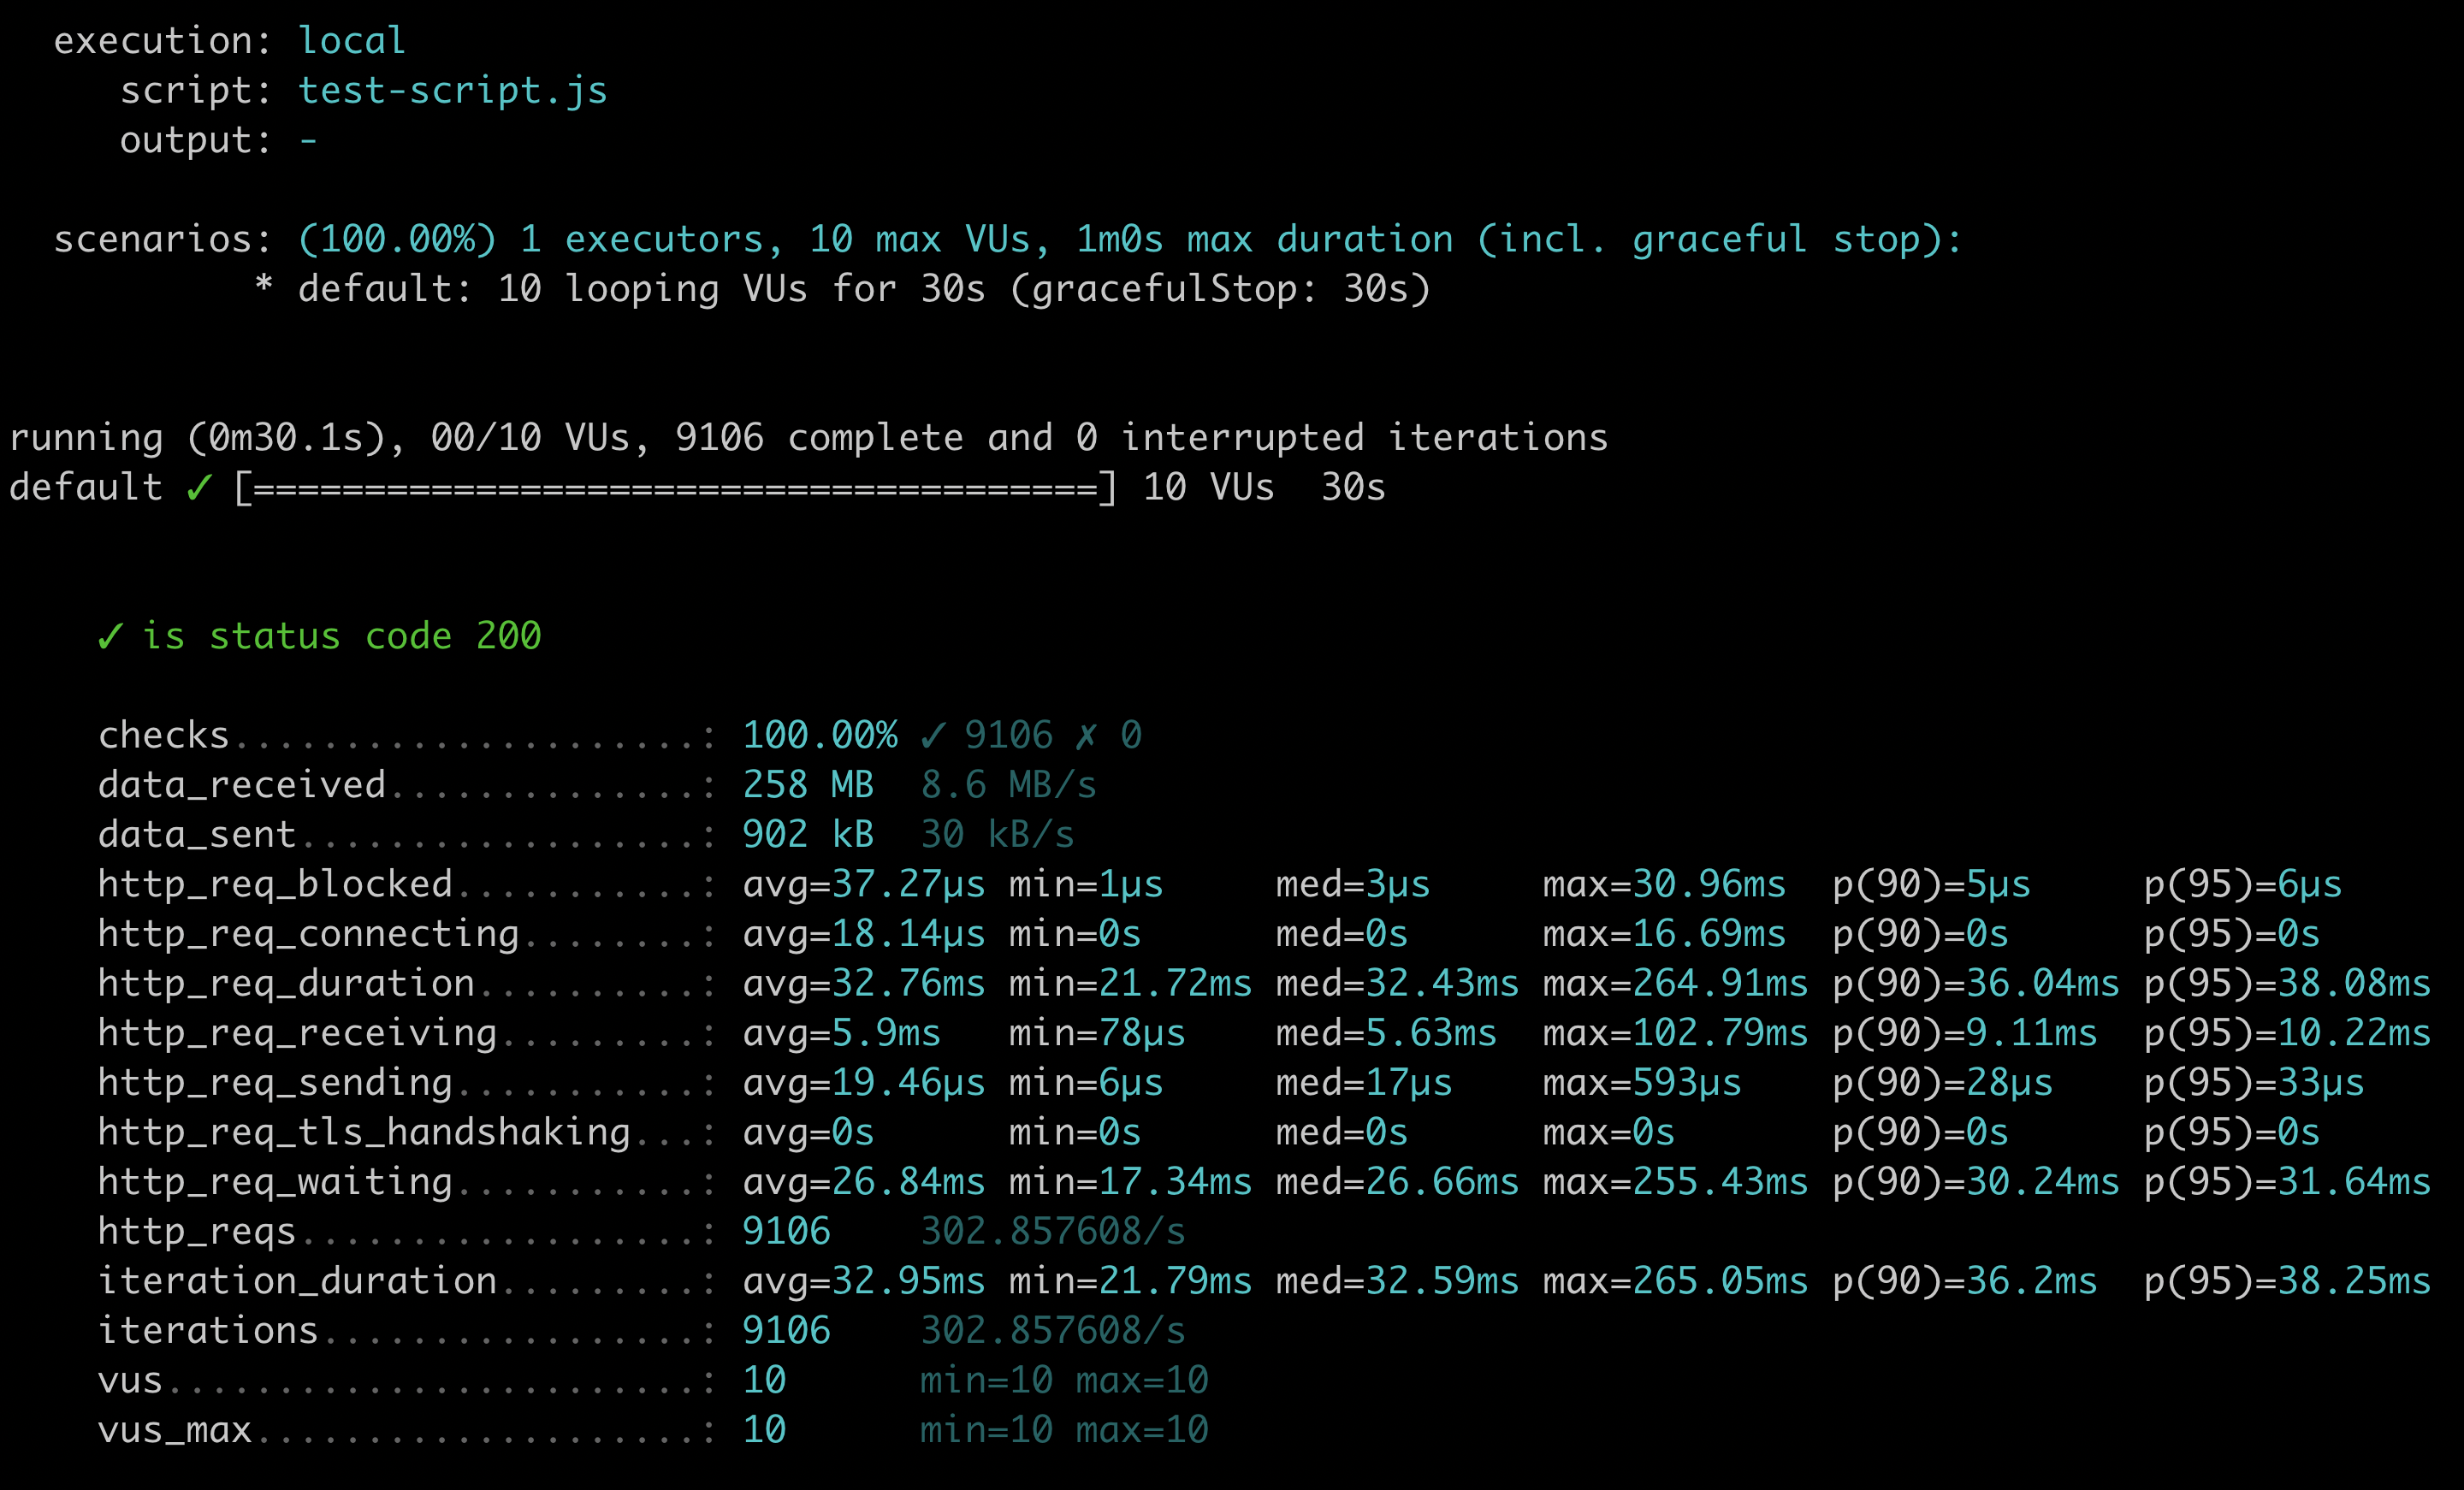
The -u stands for users while -d stands for duration. When this has finished running, you should see a similar output like the one below:

From the above standard output, you have the following information:
- What the execution type is - in this case, it’s local since I am running it locally on my machine.
- What the script name is.
- Scenario details such as executor, number of virtual users and duration.
- Our test scenario itself with a green tick which means that it has passed.
- Different metrics and http_req specific metrics that are built-in from k6.
Each of these metrics has 5 values such as its average response time, min, median, max, 90th and 95th percentile. From here, you can rerun the test multiple times, make a note of these metrics and analyse if any of the values are deviating. I recommend having a look at k6’s metric page here to get a deeper understanding of these metrics.
Apart from these built-in metrics, k6 also allows you to have custom metrics that you can define programmatically in your code.
Handling ramp up and ramp down in your k6 test
So far, you’ve seen how to run the sample test above from the command line with 10 virtual users and 30 seconds duration time. But what about simulating ramp up and ramp down time? It’s important to simulate this because in the real world, you’ll get users visiting your application at various times and not all at once. The good thing is k6 can set this up easily but you’ll have to write some additional code for it as this is something that can’t be achieved using the k6 command.
To do this, we can add the following to our test.
export const options = {
  vus: 50,
  stages: [
    { duration: '30s', target: 10 },
    { duration: '1m', target: 40 },
    { duration: '30s', target: 0 },
  ]
};
The options above defined what the ramp up and ramp down time is for 50 virtual users. For the first 30 seconds, we’ll ramp it up with 10 users. Then on the next minute, with 40 users and then start to ramp down after 30 seconds.
Grouping your k6 tests
It’s also a good idea to group your tests so you have a structure that easily visualised your tests. For example, if you need to write performance tests on different endpoints, it makes sense to group the tests per endpoints. k6 allows this through the group feature.
import http from 'k6/http';
import { check, group } from 'k6';

const baseUrl = 'http://jsonplaceholder.typicode.com';

export const options = {
  vus: 50,
  stages: [
    { duration: '30s', target: 10 },
    { duration: '1m', target: 40 },
    { duration: '30s', target: 0 },
  ]
};

export default function () {
  group('JSON Placeholder Performance Testing', function () {
    group('Posts endpoint', function () {
      const res = http.get(`${baseUrl}/posts`);
      check(res, {
        'is status code 200': (r) => r.status === 200,
      });
    });

    group('Todos endpoint', function () {
      const res = http.get(`${baseUrl}/todos`);
      check(res, {
        'is status code 200': (r) => r.status === 200,
      });
    });
  });
}
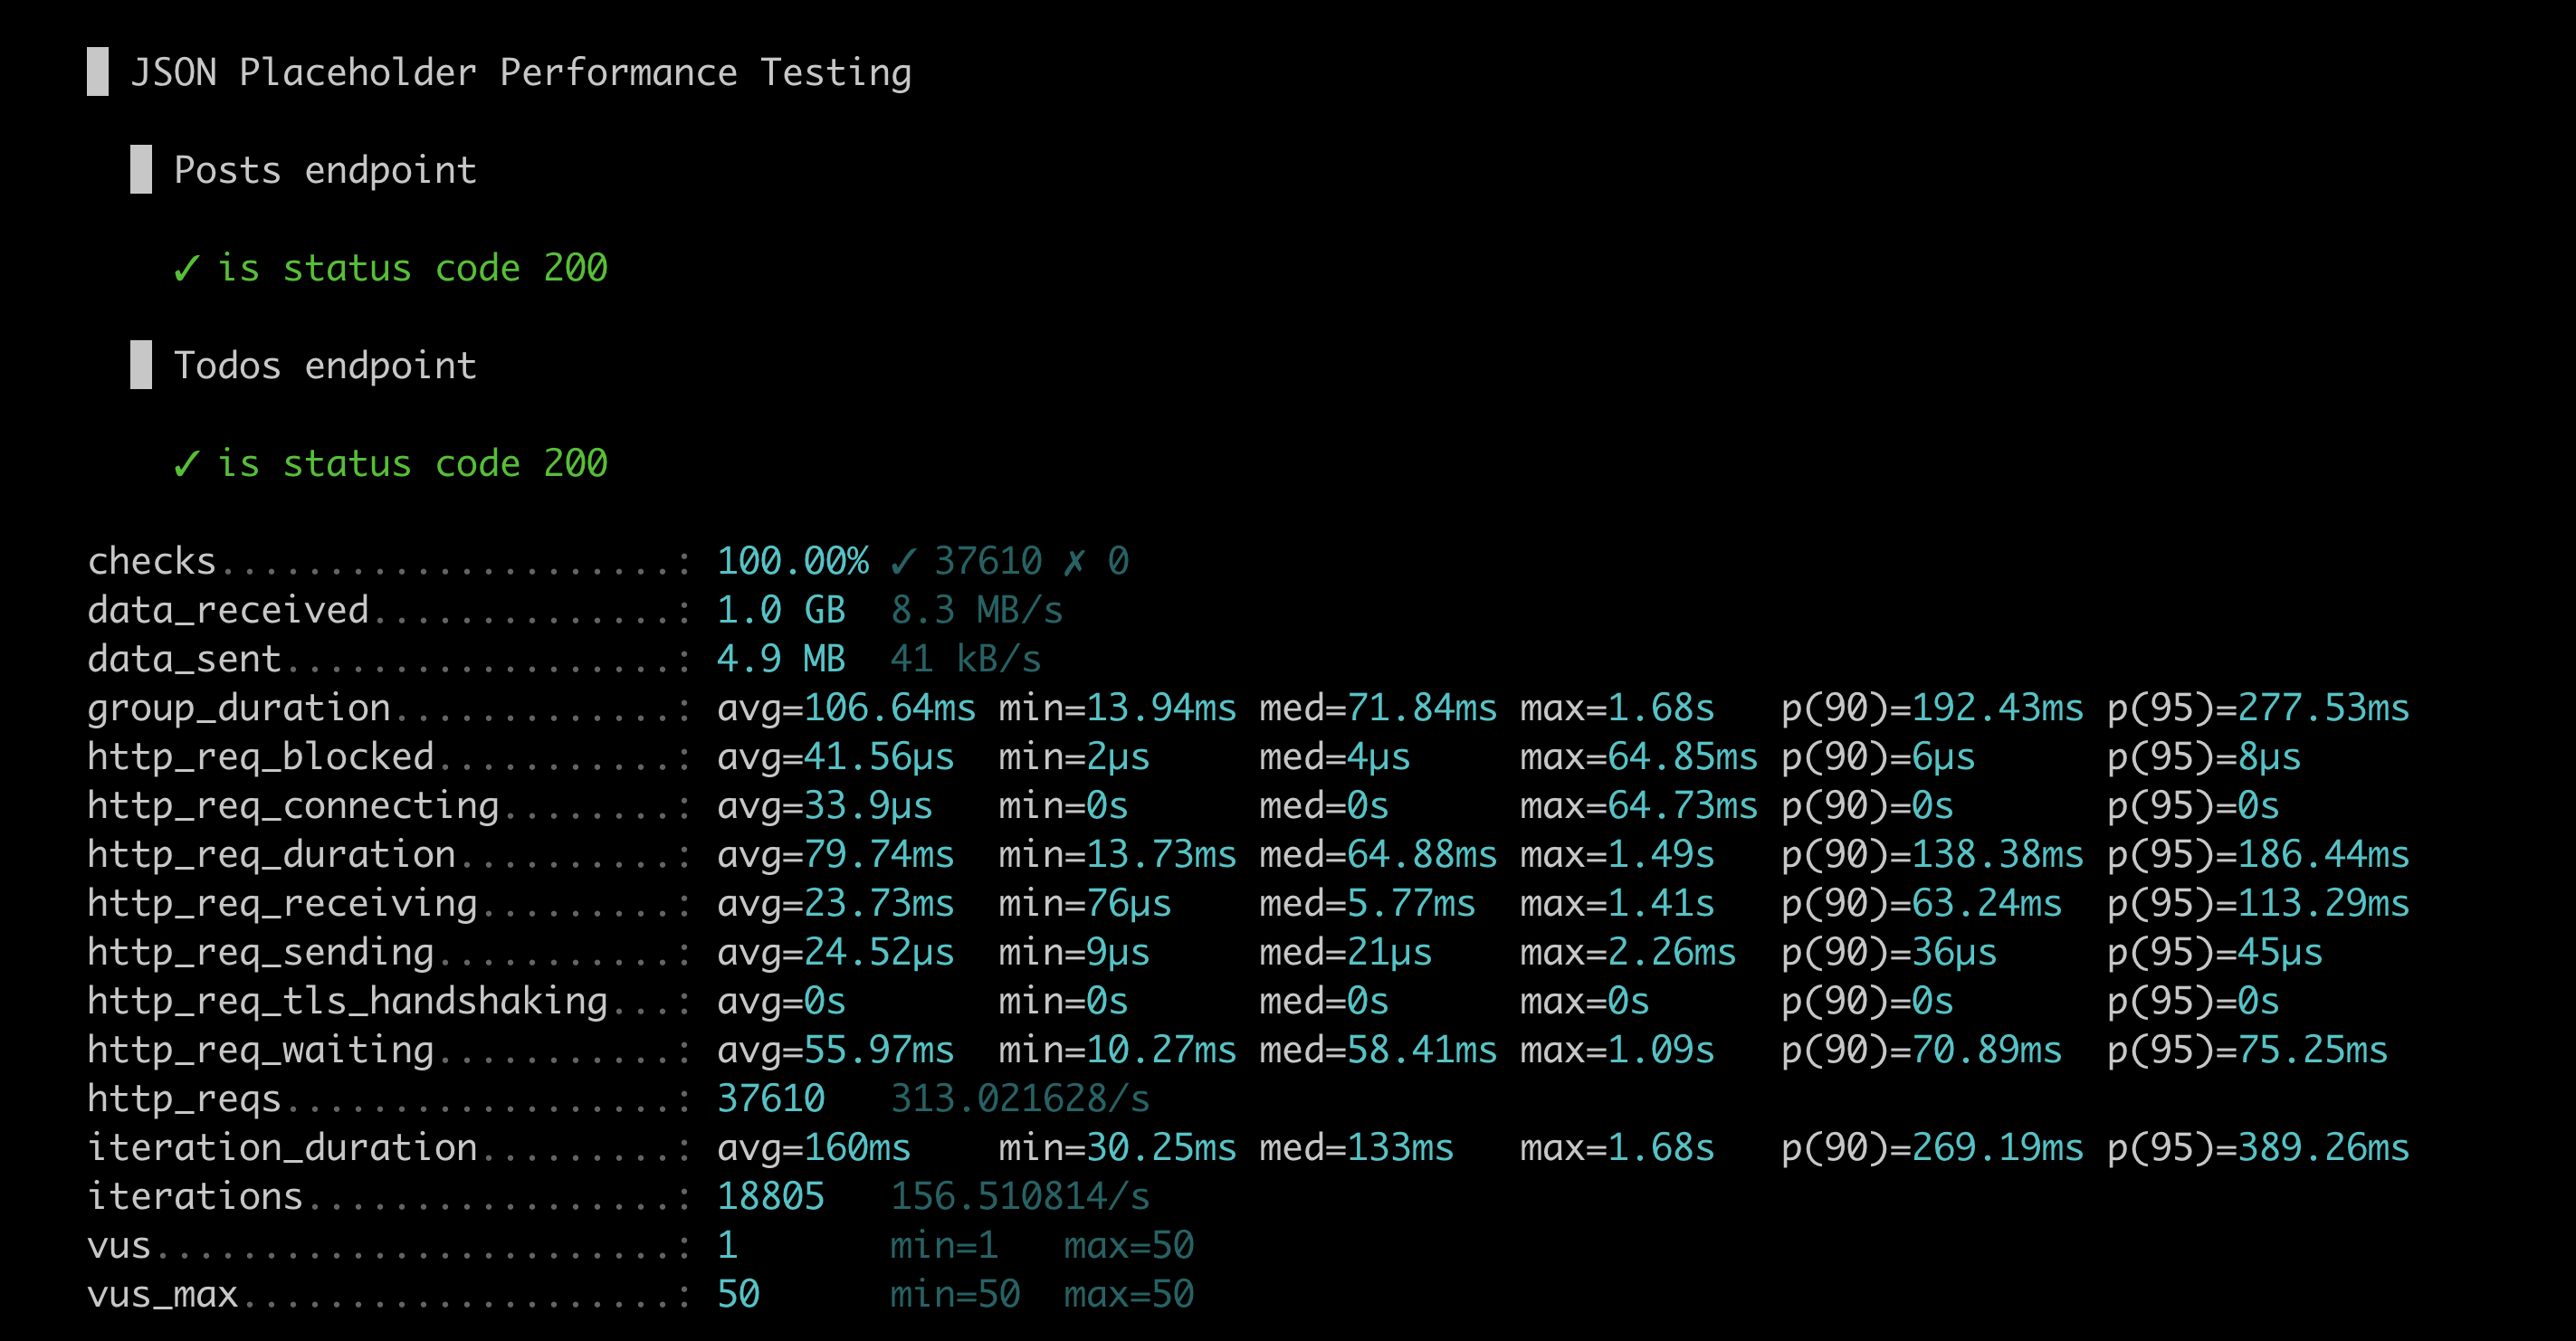
It’s quite similar to a Mocha describe block if you think about it. Now when you run the test again, your scenarios should be broken down like how you see in the screenshot below.

Setting Error Thresholds
The last thing that I want to talk about is setting error thresholds for your tests. Let’s say that your team has decided some important metrics that your tests should meet for it to pass. To do this, we need to extend our options and include some threshold metrics.
export const options = {
  vus: 50,
  stages: [
    { duration: '30s', target: 10 },
    { duration: '1m', target: 40 },
    { duration: '30s', target: 0 },
  ],
  thresholds: {
    checks: [
      { threshold: 'rate>0.9', abortOnFail: true, delayAbortEval: '10s' },
    ],
    http_req_duration: ['avg<50'],
  },
};
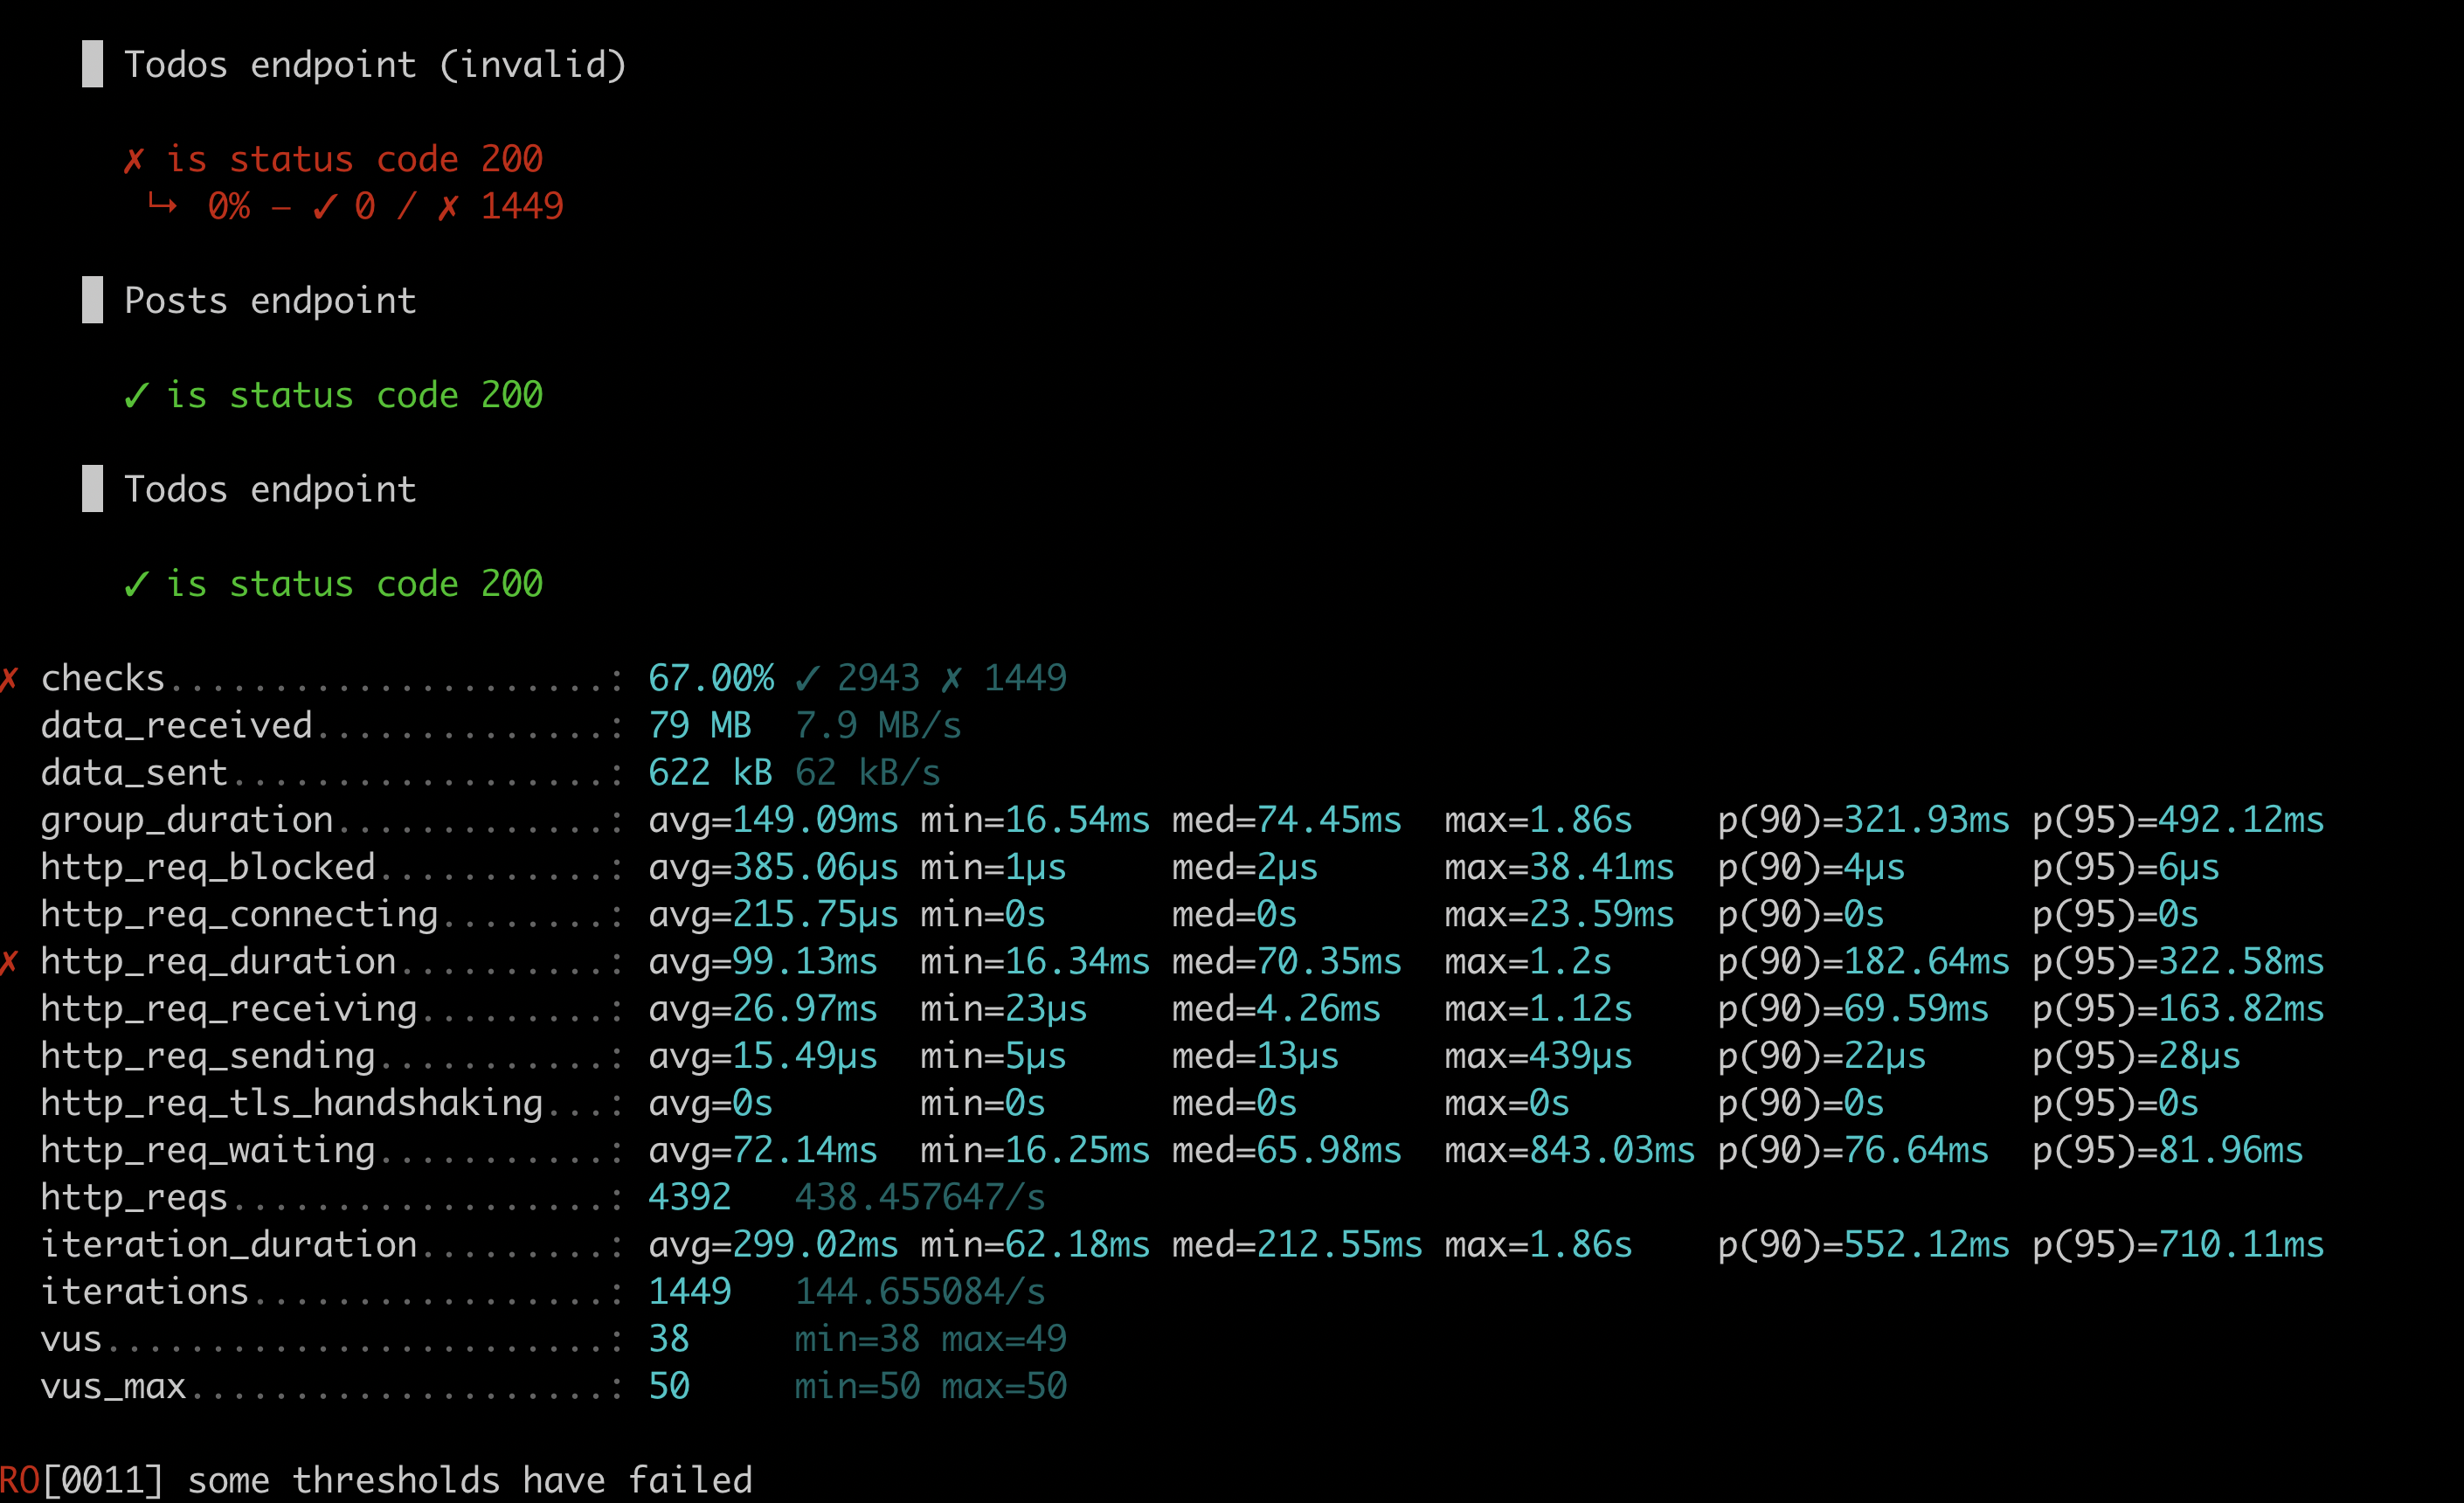
Under thresholds, I’ve defined that the checks should have a passing rate of above 90% and the duration of a request should be less than 50 milliseconds. With thresholds, you can also configure it so your test will abort its execution if errors were observed. This is done by setting the abortOnFail property to true. If you want to collect sample metrics before you abort your test, you can also set a delay to the execution before it aborts by setting delayAbortEval with relative time strings. This is pretty much configurable and you can also define custom error rates by using the Rate custom metric which you can read more on this k6 rate documentation. To demo the scenario that the checks metric will fail, I’ve added an additional test that is making a request to an invalid API endpoint which you can see below.

As you can see, 2 errors were reported because the checks percentage is at 66% and the http_req_duration average is more than 50ms. It’s that simple to set up!
Additional Resources
I hope you found this post useful. Feel free to look at my k6 sample Github repository showing all the code that you’ve seen today but if you want to know more about k6, check out the following links:
- Performance Testing Podcast with Joe Colantonio and Robin Gustafsson - a podcast interview with Robin Gustafsson, who is the CTO of Load Impact. He gave a really insightful interview on why we need to push performance testing earlier on and how tools such as k6 can help you achieve this.
- Beginner’s Guide To Load Testing with k6 by Mostafa Moradian - a series of posts from Mostafa which is jam-packed with a lot of important details on how to use k6 and performance testing in general.
- Simon Aronsson: A code-first approach to performance engineering - In this perfguild episode, you can see k6 in action and how to integrate it to CI pipelines and visualise the reporting using Grafana.